Sign up for dispatches from our public workshop
Why Go Fast? + Missouri Vehicle Stops Updates
Journalism is software, and software improves through friction, testing, and real-world use.
February 27, 2026 · David Eads · Edited by Tory Lysik, Ash Ngu
Leer en español →Field notes
In the last post, we said: “Quality over quantity, but speed over indecision and excessive deliberation.”
I want to elaborate a bit so you don’t think we were channeling a 2014 Medium post or Pinterest quote about moving fast and breaking things.
It’s not that speed is inherently good or bad, and deliberation is obviously critical — especially in investigative work, where the cost of getting something wrong can be enormous. But journalism is no longer just writing an article or producing a linear broadcast segment. It’s data and software, too. And software doesn’t improve through contemplation. It improves through friction, testing, and real-world use — assuming there are processes in place to keep improving it.
The space where deliberation lives has shifted. It used to be concentrated almost entirely before publication, perfecting a one-shot product that you pray is going to land in the small window of attention it garners. Now, deliberation belongs inside an ongoing process shaped by how people actually engage with your product. Once something is live, it enters a conversation we can’t choreograph. People click where we didn’t expect, they ignore what we thought was central, they struggle in places we assumed were obvious. That behavior isn’t noise. It’s information — information we ought to combine with our expertise to make the work sturdier and more useful over time.
When we deliberate in a vacuum, unconscious bias and assumptions harden without being tested. We convince ourselves we know where the value lies. Yet value often only reveals itself when the work is used and stress-tested by real people in the real world. Not all at once, and not always where we expect it to.
Speed, in that sense, isn’t about haste. It’s about resilience. It’s about maximizing responsiveness and preventing our own internal narratives from calcifying into blind spots.
This week’s improvements are another small exercise in that philosophy. Build something useful. Ship it. Then iterate with boring, reliable systems—version control, tests, clear docs, and reproducible data pipelines.
We’re not yet at the point where user feedback or analytics are driving our latest updates; these were planned features we didn’t want to block launch for, and they were queued because they make the tool more useful for us as we analyze and try to understand this data, which is often a good place to start.
Over the coming months, as real usage, feedback, and analytics signals accumulate, we’ll use that to sharpen our questions, improve the structure, and make the service more useful.
Updates to Missouri Vehicle Stops
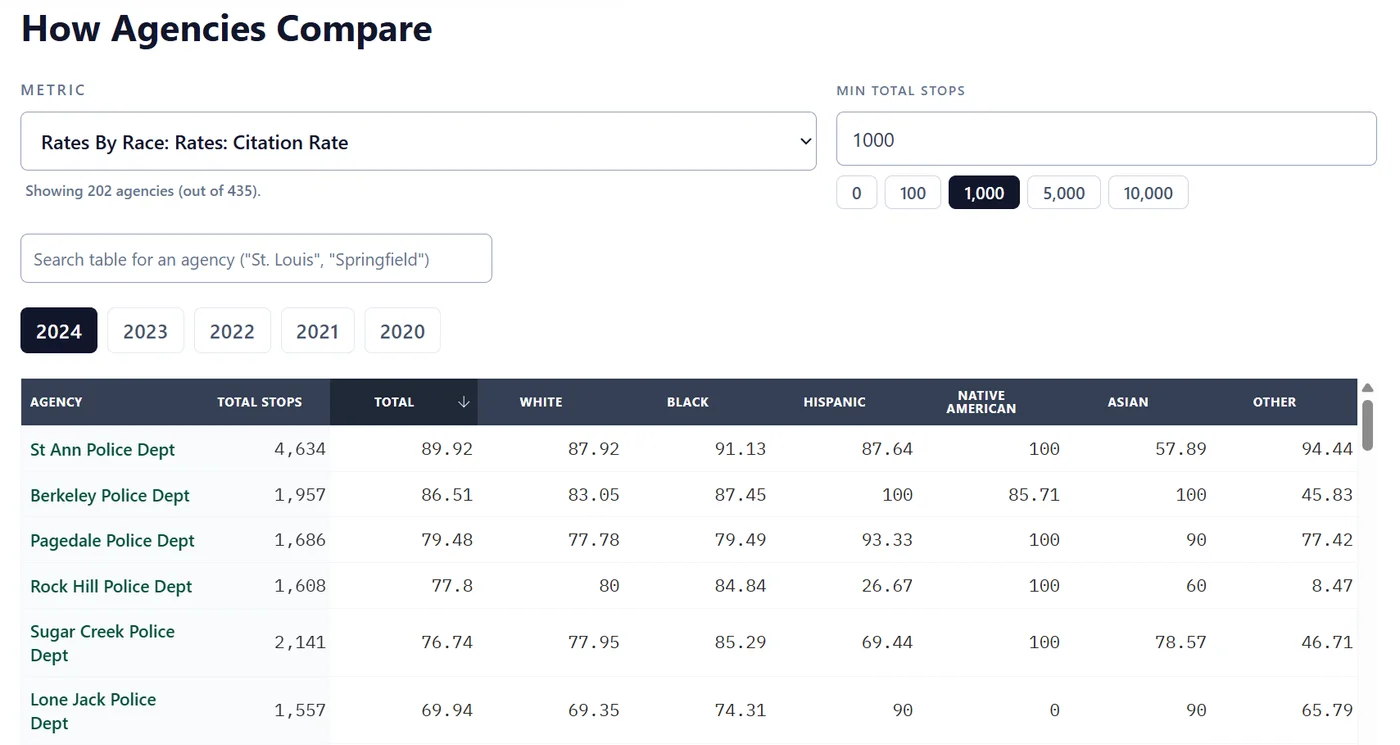
Compare agencies statewide: We added a new “How Agencies Compare” table that lets you compare agencies across Missouri on a selected metric and year in one view. The table is sortable, searchable, and includes a minimum total stops filter (with quick presets) so you can focus on meaningful comparisons.
Consistent source for statewide racial makeup: On the homepage, we have a chart showing the racial makeup of Missouri’s population compared with the percentage of each group stopped. The Census Bureau publishes multiple estimates, and we were using a different one than the state’s official report. For consistency, we’ve adjusted those charts to use the same American Community Survey five-year estimates the state uses.
Sign up for dispatches from our public workshop