
Sign up for dispatches from our public workshop
Nearly half of interstate miles now run where officers can make immigration arrests on patrol
At the start of 2025, it was zero. State patrols and county sheriffs, mostly in the South, account for nearly all of it.
November 20, 2026 · David Eads · Edited by Tory Lysik
About 49% of interstate highway miles now fall in places where state or local officers can make immigration arrests on patrol through a 287(g) agreement with Immigration and Customs Enforcement. At the beginning of 2025 — the start of Donald Trump’s second term — it was 0%.
Agreements with ICE have exploded since Trump took office in 2025, which immediately raises a classic question: How do you measure it?
All the ways of measuring are useful, but flawed. A count of agencies doesn’t show how far 287(g) reaches, or where. Residential population doesn’t include all the people who travel through or visit a jurisdiction. Physical land is mostly empty space and doesn’t tell you much beyond bluntly showing the vastness and emptiness of the US. Data about federal funding flowing to departments is scarce.
Measuring major roads that cross a jurisdiction is another useful and flawed way to gauge the program’s spread. It is, in some sense, a measurement of exposure. Some routes have heightened immigration enforcement authority, sometimes for hundreds of miles.
Plus, Americans drive a lot. The sheer size of the US means people spend a lot of time in cars and traffic stops are the most common way people interact with police in their daily lives.
The 49% counts only Task Force Model agreements, the kind that gives officers the ability to question people about their immigration status and arrest them during patrols and traffic stops. ICE had dropped the model in 2012, and the Trump administration revived it in 2025, which is why the count starts at zero. The other agreements, the Jail Enforcement Model and Warrant Service Officer program, apply only after someone has been booked into a jail for a non-immigration-related charge. The 49% also counts state patrols that have Task Force agreements and whose jurisdiction includes every interstate in their state.
How much of the map counts depends on which agreements and which agencies you include:
| Share of interstate miles | Local agencies only | Counting state patrols |
|---|---|---|
| Task Force agreements | 19% (0% at the start of 2025) | 49% (0%) |
| Any 287(g) agreement | 30% (6%) | 52% (6%) |
For the remainder of this analysis, we’ll mostly focus on local agencies alone, which isolates the trends in local agencies and offers a conservative baseline for the spread of the program.
Explore which routes do and don’t cross 287(g) jurisdictions in our tool or read on for more about what we found.
Overlapping jurisdictions
State police and highway patrols do much of the policing on interstates and their jurisdiction is statewide. In 20 states, the patrol has its own Task Force agreement. Counting them takes the Task Force share from 19% to 49%.
The next level is county and unsurprisingly, nearly all of the mileage attributable to local departments comes from county agencies — mostly sheriffs’ offices. Towns add almost no reach of their own: just 0.2 points of the 30% covered by local agencies run through a 287(g) town in a county whose sheriff hasn’t signed. The patchwork of agreements at different levels makes enforcement denser, not longer. A driver in Sarcoxie, Missouri could be pulled over by the local police, county sheriff, state highway patrol, or federal agents and face federal immigration enforcement.
Another complicating factor is that the size of the department has no relation to the scope of the agreement. These agreements cover only the officers their agency nominates and ICE trains. Some are small: Iowa trained three troopers, and North Carolina’s patrol limited its agreement to two units.
A closer look: Missouri
Missouri offers a very useful look at how this breaks down at a state level.
Local agreements now cover 55% of Missouri’s interstate miles, up from none at the start of 2025. But the agency that makes the most stops on those interstates is the State Highway Patrol, which signed a Task Force agreement in March 2025, though it reportedly didn’t start using it until that fall. Counting the patrol, every interstate mile in the state is covered.
Missouri’s annual Vehicle Stops Report, which we publish in searchable form, counts interstate stops by agency and by the driver’s race. Of about 168,000 stops on Missouri’s interstates in 2025, the patrol made 47% and local agencies that now have agreements made 9%: 56% in all. All but one of those local agreements are Task Force agreements.
Hispanic-identified drivers are a bigger share of stops on the interstates: 7.2% of the patrol’s interstate stops, against 4.4% of all its stops. Troopers searched Hispanic drivers at 6.2% of stops, against 3.6% for White drivers, and found contraband less often: in 13% of searches, against 23%. That’s the same pattern we found statewide in our analysis of the 2025 report.
One number to watch: in 2025, the patrol’s stops of Hispanic drivers fell 13%, while its stops overall fell 8%. The yearly data can’t say why, and the report doesn’t record immigration questions or referrals to ICE. The 2026 report, due by June 2027, will be the first to cover a full year with most of Missouri’s agreements in force.
The short spike and long tail of immigration enforcement
Interstate coverage from local agencies climbed fastest in the administration’s first year, to 23% by January 2026. The wave of small departments that has signed on since April, which we wrote about in July and discussed on Instagram this week, added about six more points, more than making up for the miles lost when Maryland and New York banned the agreements.
View the data
| Month | Miles covered, month end | signed |
|---|---|---|
| Jan '25 | 6% | 2 |
| Feb '25 | 7.8% | 83 |
| Mar '25 | 9.8% | 117 |
| Apr '25 | 10.8% | 101 |
| May '25 | 13% | 87 |
| Jun '25 | 14.8% | 98 |
| Jul '25 | 17% | 114 |
| Aug '25 | 18.5% | 72 |
| Sep '25 | 19.2% | 63 |
| Oct '25 | 20.7% | 49 |
| Nov '25 | 21.7% | 86 |
| Dec '25 | 22.9% | 75 |
| Jan '26 | 23.7% | 101 |
| Feb '26 | 24.1% | 108 |
| Mar '26 | 24.6% | 110 |
| Apr '26 | 25.7% | 141 |
| May '26 | 25.9% | 117 |
| Jun '26 | 26.5% | 156 |
| Jul '26 | 27.5% | 169 |
| Aug '26 | 28% | 179 |
| Sep '26 | 28.8% | 165 |
| Oct '26 | 29.8% | 129 |
| Nov '26 | 29.9% | 38 |
Maryland’s interstates went from 38% covered to none after the state banned the agreements in February. New York’s fell from 16% to 1% after its own ban took effect in August.
Heaviest concentration in the South
Florida’s coverage, even excluding state agencies, is 100%. That’s because state law requires its sheriffs to sign. But it holds only 3% of the lower 48’s interstate miles.
The biggest jumps came elsewhere in the South. Tennessee is at 93%, up from 9% at the start of 2025, and Arkansas is at 87%, up from 4%. Texas is at 74%. Like Florida, Texas has a law compelling participation. Kansas, Missouri and West Virginia had none at the start of 2025; now each is above half.
The gap between Task Force and other agreements is widest where sheriffs signed jail agreements. Tennessee is at 93% counting any local agreement, but only 35% through a local Task Force agreement; its highway patrol’s own agreement covers the rest.
Outside Florida, you can drive about 300 miles of I-44 from northeastern Oklahoma to the edge of St. Louis, 290 miles of I-20 west from Arlington, Texas, to Big Spring, or 335 miles of I-40 from central Oklahoma across most of Arkansas without leaving a county or town in the program.
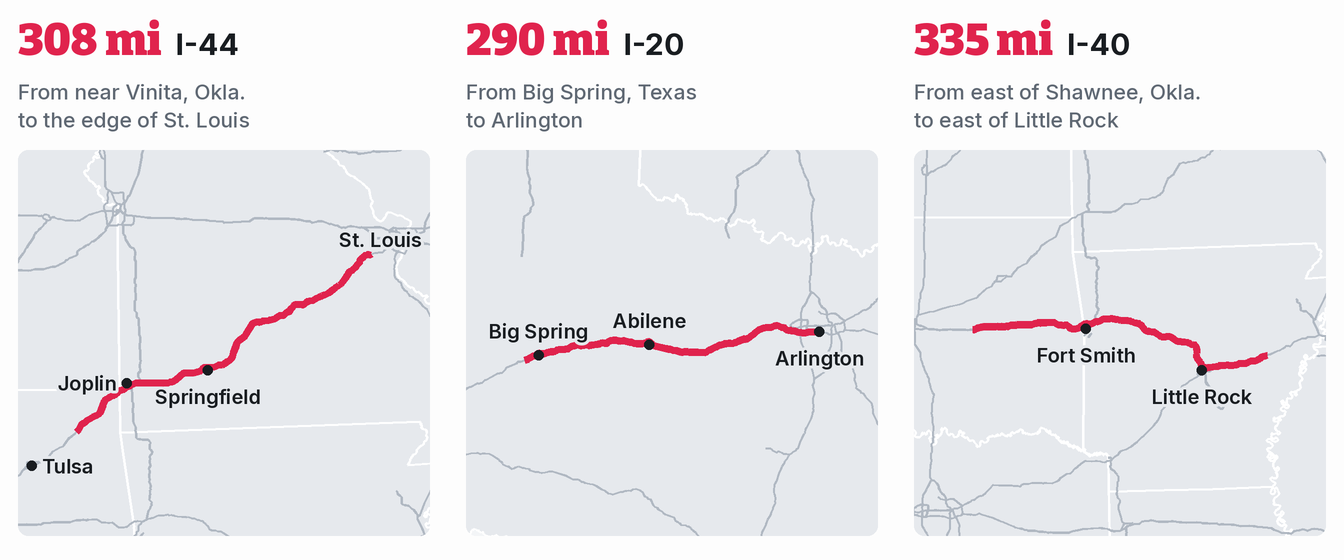
An agreement isn’t a checkpoint. We don’t know how many officers along these roads are trained or how many traffic stops end in an immigration arrest; no national data shows that. What the map shows is where officers now have the authority.
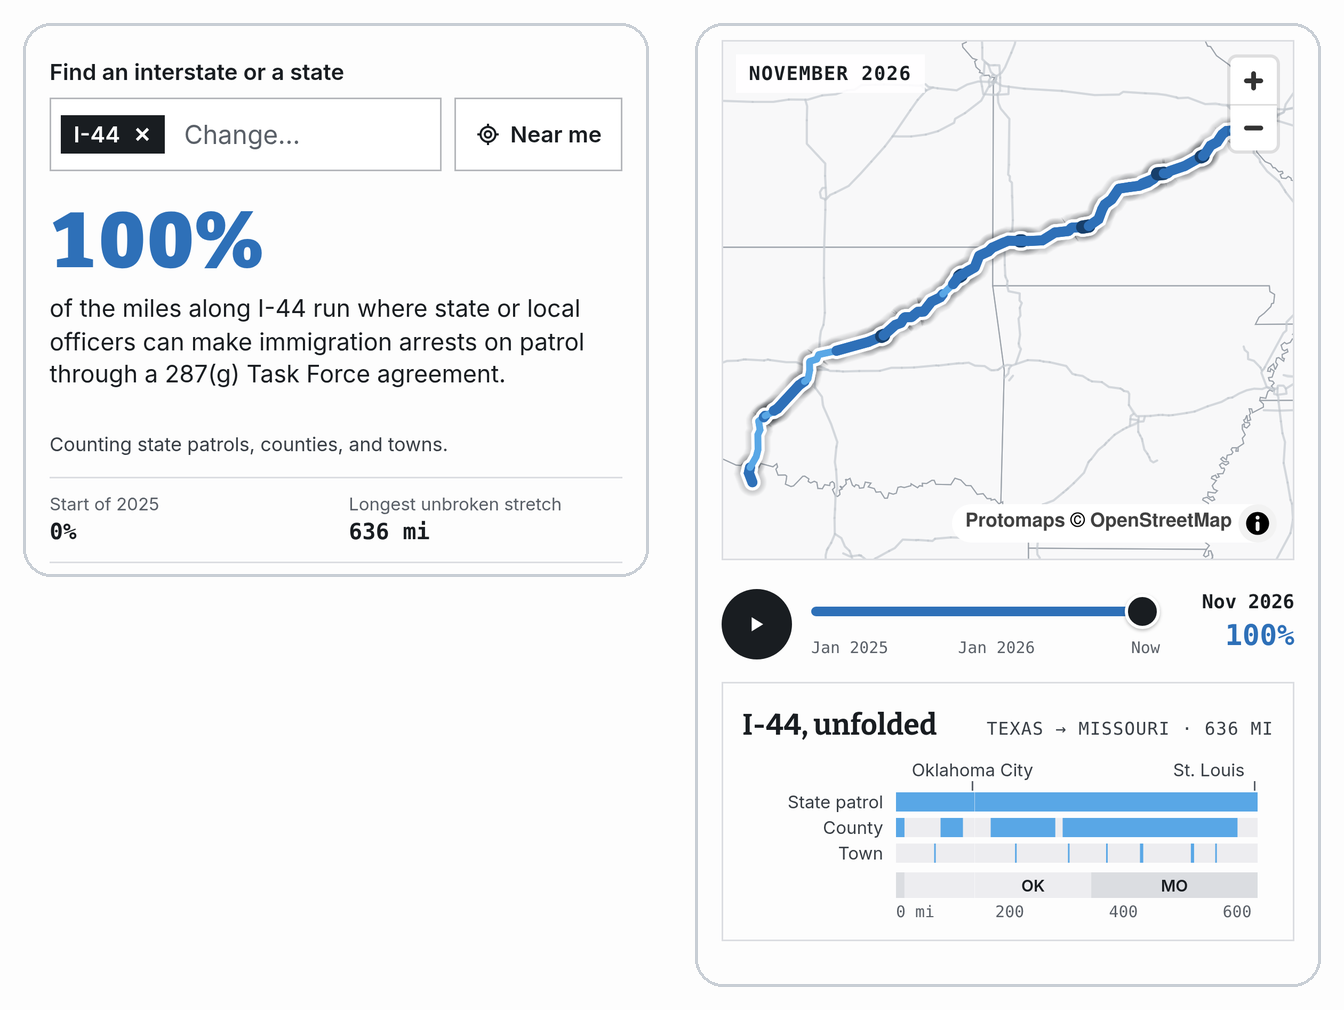
Explore every interstate on 287(g) Watch. Pick a route to see which agencies cover it, state by state, or find the interstate nearest you. The explorer updates with each new version of ICE's list, so its numbers can move from the ones here.
⁘ ⁘ ⁘
How we counted
- Roads: interstates in the lower 48 from the Census Bureau’s 2024 TIGER/Line primary roads.
- Agencies: every local agency on ICE’s 287(g) list, from the 287(g) Watch snapshot of Nov. 16, 2026, matched to its Census county or town boundary. A stretch of road counts as covered on a given date if it lies inside the boundary of an agency that had signed by then and hadn’t yet left ICE’s list. Sheriffs are drawn across their whole county.
- Matching isn’t perfect: we place a town’s police department by the town in its name, and every other local agency by the county ICE lists for it. Where ICE’s labels are off, or a town’s name matches the wrong place, an agency can land in the wrong county or town, or in none. We corrected the cases we found.
- Census boundaries aren’t jurisdictions: a county or town boundary stands in for where an agency’s officers work, and the two don’t always line up. A police department may patrol past its town’s limits or serve a neighboring town by contract, and a sheriff may patrol less of a county whose towns have their own police.
- Which agreements: the 49% counts Task Force Model agreements only, from each agency’s Task Force signing date in ICE’s list, local and state patrol. Unless noted otherwise, state, route and stretch figures count local agencies with any type of agreement.
- State patrols: a state’s whole interstate network counts from the date its patrol’s agreement was signed. The 20 states are Arkansas, Florida, Georgia, Idaho, Indiana, Iowa, Louisiana, Mississippi, Missouri, Montana, Nebraska, New Hampshire, North Carolina, Oklahoma, South Carolina, South Dakota, Tennessee, Texas, West Virginia and Wyoming. Where the agreement is with a parent department (Georgia, Iowa, Mississippi, Montana, Oklahoma, South Carolina and Tennessee), we confirmed from the agreement or official statements that troopers are covered.
- Not counted: other state agencies, like corrections departments and investigative bureaus, and about 60 local agencies, like jails and task forces, that don’t match a county or town boundary. This way the numbers err low.
- Shares of routes, not sum of all line segments: divided highways appear twice in TIGER, once for each direction, so we report percentages of interstate length rather than mile counts.
Sign up for dispatches from our public workshop